Thanks for using GSC Helper 🎉. In case something is unclear, take a look at this extensive FAQ document. If a question is still unanswered, please leave a comment or get in touch with stephan@searchanalyzer.io.
When you are looking for the update notes, please follow the link.
Table of content
- 1 Feature list
- 2 Performance report x GSC Helper
- 3 Visualize performance data by week / month / quarter
- 4 Enhanced page stats
- 5 Compare page performance over time
- 6 Enhanced query performance
- 7 Enhanced query performance over time
- 8 Index coverage report actions
- 9 Account chooser on „not verified page“
- 10 Options menu
- 10.1 Where do I find the options?
- 10.2 What can I do within „Configure GSC deep link“?
- 10.3 What is „Show GSC tables at full-width“?
- 10.4 What is „Add a Open URL Link in Front of URLs“?
- 10.5 What is „Add Search Link For Queries“?
- 10.6 What is „Define your chart colors“?
- 10.7 What is „Highlight Traffic Share“?
- 11 Extension logo actions
- 12 Context menu actions
- 13 General FAQ
Feature list
Do you know all the functionalities GSC Helper has to offer?
- Visualize Performance Reports: Easily switch between weekly, monthly, or quarterly views by clicking the extension logo in the „Dates“ section of GSC.
- Set and Compare Dates Effortlessly: Use the context menu to quickly set and compare dates in your GSC performance report, streamlining your analysis.
- Apply RegEx Filters with Ease: Analyze queries and URLs by loading RegEx filters through the context menu, giving you deeper insights.
- Create and Load Custom RegEx Patterns: Customize your analysis by creating and loading your own RegEx patterns directly from the extension.
- Enhance URL Traffic Insights: Gain more detailed traffic stats for specific pages by clicking the extension logo while in the „Page“ view of GSC.
- Deepen Your Search Query Analysis: Access additional insights into your search query traffic by clicking the extension logo in the „Query“ view. Understand traffic patterns with n-grams.
- Compare Your Search Query Performance: How are your queries performing over time? Compare two periods and head of to the „Query“ view and click the extension logo.
- Extract Sample URLs from Index Coverage: Easily pull sample URLs from the index coverage report for further analysis.
- Analyze Visited Pages Instantly: Quickly analyze the performance of the page you’re currently viewing by clicking the extension logo.
- Access GSC Reports from Anywhere: Use context menu links to open various GSC reports, even when you’re browsing outside of GSC.
Performance report x GSC Helper
The GSC performance reports are the core of Google Search Console. GSC Helper works with all three performance reports („normal performance report“, Discover, News). See which actions are available to you.
When you are inside Google Search Console, a right mouse button click allows you to access various „date actions“ to set dates easily.
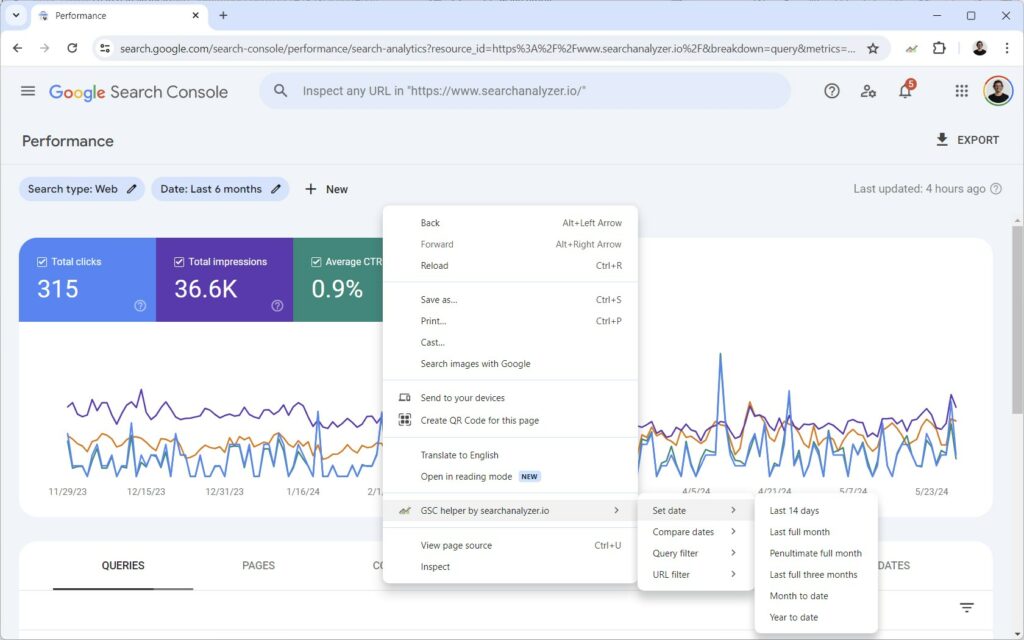
You have the following options within „Set date„:
- Last 14 days: Will set the date to TODAY-16 days to TODAY-2 days, as Google Search Console has a two-day delay. So on the 30th of May, the date will be 14.05 to 28.05.
- Last full month: Choose this to see the performance of the last complete month. On the 30th of May, this will give you April data, as May only offers partial data right now.
- Penultimate full month: Penultimate means „the [week/month] before last month“, so in this case, you will get March data when you are selecting this time frame in May.
- Last full three months: Covers the last completely available months. Sticking to my example, this gives you 01.02 to 30.04
- Month to date: This option sets the date from the first of the current month till TODAY-2 days, due to the data delay. So you would get 01.05 to 28.05.
- Year to date: Similar to above, but 01.01 is chosen as the starting day.
When you want to compare the performance over time, these options are available to you:
- Compare last full week vs. penultimate week: The last available complete week (Mon to Sun) is compared vs. the week before.
- Compare last 14 days vs. 14 days before: Takes the current day and calculates TODAY-16 to TODAY-2, vs. the TODAY-31 to TODAY-17, so you can easily prepare the last 14 days performance vs. the 14 days before.
- Compare last full month vs. penultimate month: Sets the date range to cover the last full month (which is usually the month before the current month), and compares it to the month before. So in May, it will be 01.04 vs. 01.03.
- Month to date vs. penultimate month to date: Month to data sets the data to 01.[current-month] to TODAY-2 days, and compares that period against the month before.
- Month to date vs. last year month to date: Month to data sets the data to 01.[current-month] to TODAY-2 days, and compares that period against a year ago.
With query filters, some pre-defined and custom (!) RegEx are applied to the performance report.
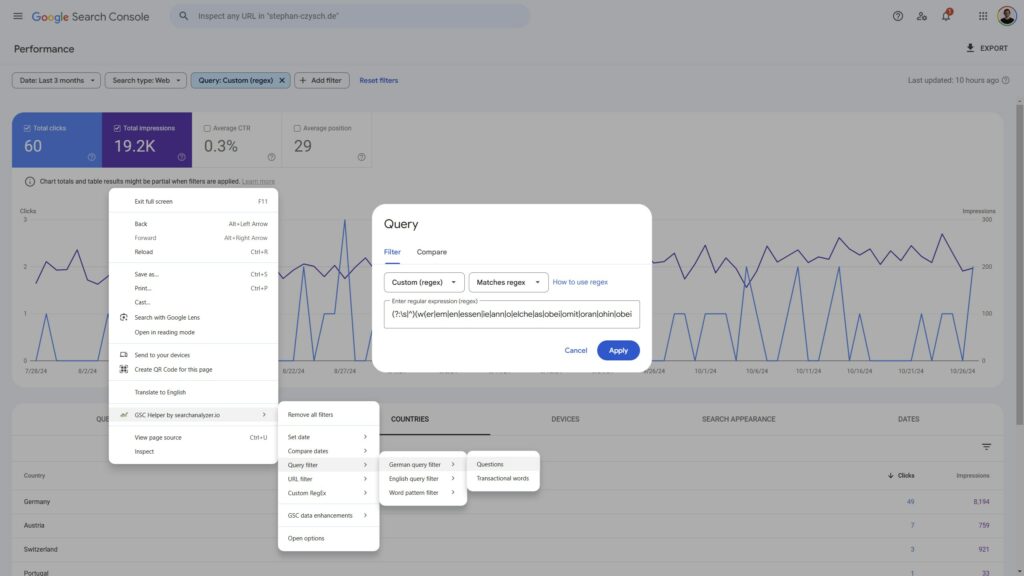
- German query filters – Questions: Adds (?:\s|^)(w(er|em|en|essen|ie|ann|o|elche|as|obei|omit|oran|ohin|obei|eshalb|arum|ieso|orauf|orum|ovor|odurch|oher|eswegen|oraus))(\s|$)|.*\?$ to find popular question terms.
- German query filters – Transactional terms: Sets the query RegEx to \b(bestell[^\s]*|ordern|kaufen|anfordern|erwerben|beziehen|besorgen|downloade?n?)\b to find words like „bestellen“
- English query filters – Questions: Filters queries for (?:^|\s)(who|what|when|where|why|how|which|whom)(?:\s|$)|.*\?$, to identify questions.
- English query filter – Transactional terms: Filters queries for \b(buy|purchase|acquire|cheap|price|order|procure|obtain|get|shop|invest|obtain)\b, to show search queries with transactional intent
- Word pattern filter: Filters for 1, 2, 3 or more than 3 word queries, or for queries including at least two digits (to find e.g. years)
Select preset filters to analyze your traffic.
- URLs with 3+ folders: Filter for URLs with more than 3 folders
- URLs with parameters: Filters for URLs containing at least one parameter
- URLs with #: Identify sitelinks by filtering for URLs containing a #
- URLs with special characters: Shows URL that containing „non-common“ characters
- URLs ending with slash: Only shows URLs that end with a slash
- URLs not ending with slash: Shows all URLs that do not end with a slash
- URLs in root: Only surfaces URLs within the root folder
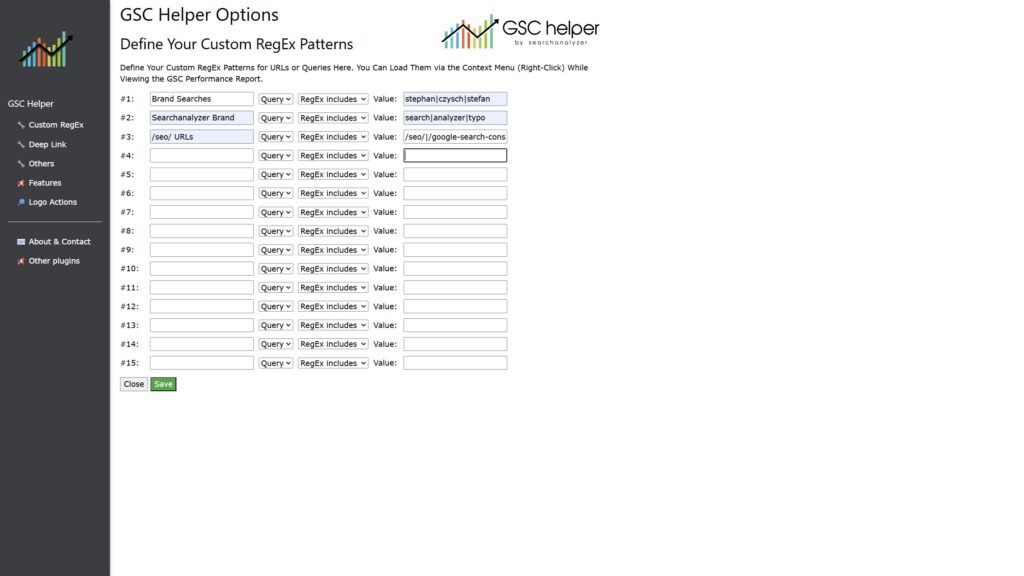
- Custom RegEx: After you setup your own RegEx filters in the options menu (right mouse button click on the logo => options, or via link in the context menu), you can load the configuration
Visualize performance data by week / month / quarter
While you are within the dates tab of Google Search Console (!), a click on the extension logo will generate the chart. Otherwise, you will see either a different visualization, or a hint.
Note: When nothing happens when you click the extension logo while being in the dates tab, refresh the GSC page and try again.
Based on the selected time frame in Google Search Console, you can either visualize the data by week, month, or quarter. So ensure to first set the needed time frame, and then start the visualization.
Note: You can change the colors of the chart in the options within the „Others“ section.
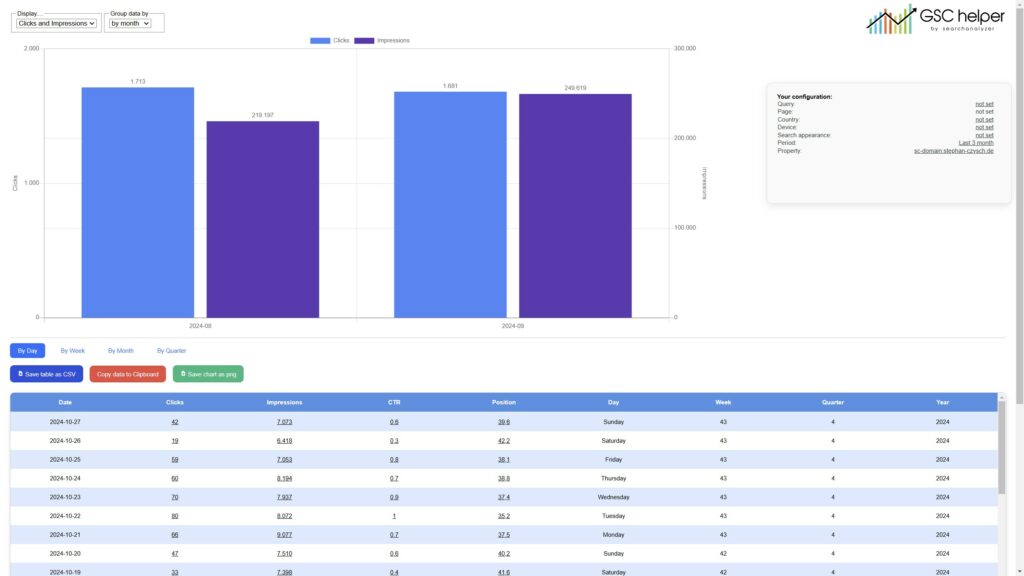
Your options on the visualization tab
On top of the chart, you can choose which data you want to see (clicks and/or impressions), and select the time frame
Below the chart, you will find the different tables with enhanced data. We are offering
- By Day
- By Week
- By Month
- By Quarter
Aggregation for you. The tables can be downloaded as .csv or be copied to your clip board. This action is tab-specific, meaning that it will give you the data of the currently active tab. On top of that, you can save the chart as a .png.
Enhanced page stats
While you are in the pages view of Google Search Console, a click on the extension logo will open an enhanced table. This enriched data is perfect for:
- Identifying your most important pages and folders
- Finding over- and underperforming pages and folders of your website
- Quickly filter for folders – and verify important folders as separate URL prefix properties in GSC
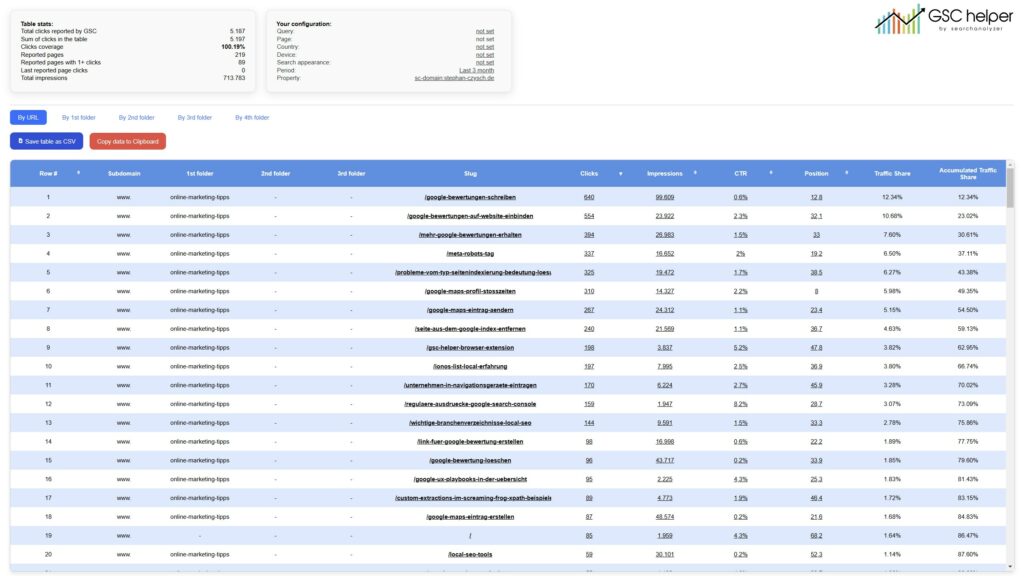
Stats section
- Total clicks is extracted from the GSC table. When you didn’t apply any page filter, the data is aggregated „byProperty“, so for each search max 1 click and 1 impression is counted.
- Reported clicks is the sum of all clicks within the extracted table. As the page data is shown „byPage“, a single search can result in more than 1 click, and when multiple pages are shown, in multiple impressions. That’s why the clicks coverage can be above 100% for sites with less than 1.000 ranking URLs.
- Clicks coverage is a calculated value by dividing total clicks / reported clicks. It can be above 100%, as a search can result any multiple clicks
- Reported pages is the count of pages within the table
- Reported pages with 1+ clicks is the count of pages with at least one click within the table
- Last reported page clicks shows the stats of the last row in the table. For big websites, the 1.000 sample URLs aren’t enough, so the last row can have more than 0 clicks
- Total impressions is extracted from the GSC table. This data point is aggregated „byProperty“ as long as you didn’t filter for pages.
Your configuration
To remind you of the configuration used before generating the enhanced table, the configuration is repeated here.
Table data – by URL
Within the table, we add additional data points:
- Row number is simply the row number 🙂
- Subdomain shows the subdomain of the URL
- 1st, 2nd and 3rd folder extracts and lists folder of a URL (if present)
- Slug shows the last part of the URL (limited to 30 characters) – hover the slug to see the full URL
- Clicks according to the GSC table data
- Impressions according to the GSC table data
- CTR according to the GSC table data
- Position according to the GSC table data
- Traffic Share is a calculated value. We take the total clicks (see above), and divide it by the clicks of the page
- Accumulated Traffic Share sums of the traffic share of all URLs so far. This value indicates, how many pages generate x % of your traffic
Table data – by folder
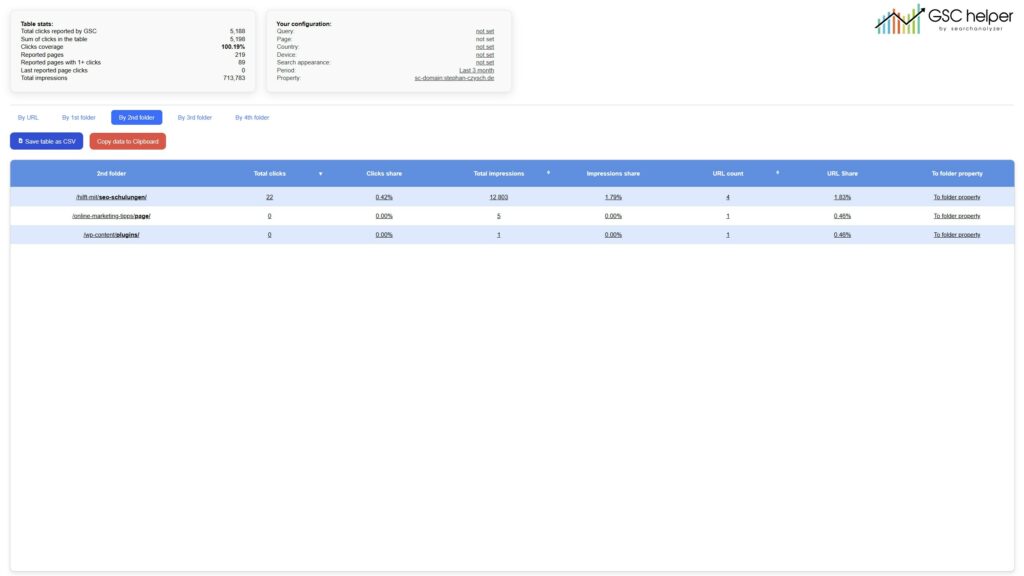
These views aggregate your data by (up to five) folders – and allow you to easily filter your GSC performance report for the folder, or adding the folder as a new property (which I highly recommend for your most important folders). The table headings show you a tooltip with more information on the data point.
- 1st, 2nd, 3rd, 4th, 5th folder displays the folder name. A click on the folder name will perform a Google site:-search for the folder
- Total clicks is the sum of all clicks of URLs in the respective folder
- Clicks share is a calculated value. It takes the total clicks as reported by GSC for your configuration, and divides it with the sum of clicks for the folder
- Total impressions is the sum of all impressions of URLs in the folder
- Impressions share is a calculated value. It takes the impressions as reported by GSC for your configuration, and divides it with the sum of impressions for the folder
- URL count is the sum of all URLs in the folder
- URL share divides the amount of URLs reported in your GSC configuration (max 1.000!), and divides it by the sum of URLs within the folder
- Analyze folder in GSC takes you to Google Search Console performance report, pre-filtered for the folder you want
- To folder property opens the folder as a separate URL prefix property, to deep dive into the folder (and potentially get more clicks and URLs!)
Compare page performance over time
With version 1.8, page performance can be compared over time. To generate the view, you need to compare two periods and view the „page“ data within Google Search Console.
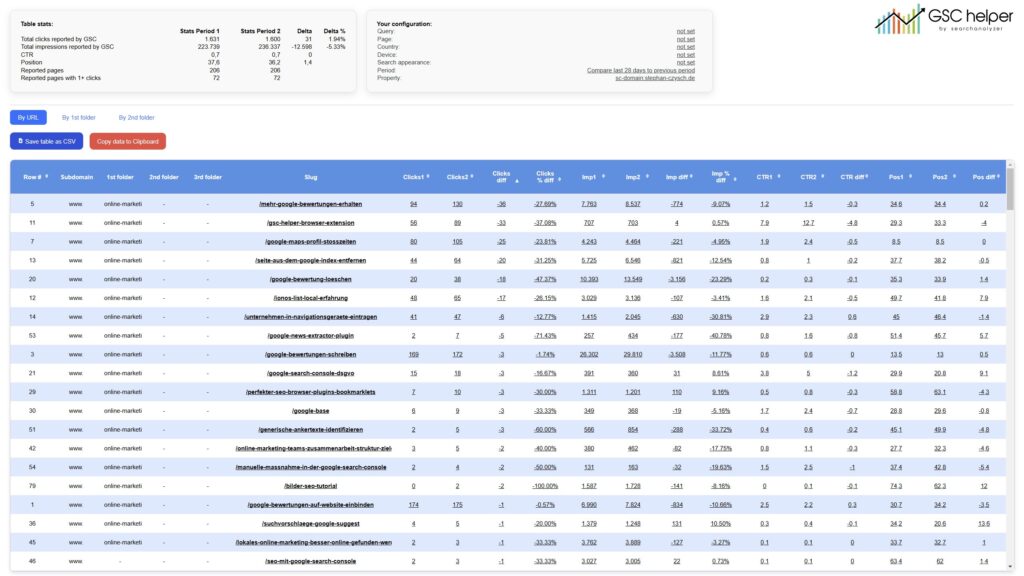
Stats and configuration
The statics are extracted from the GSC interface and are displayed separatly for each period. On top of that, you see the difference („Delta“) as absolute and percentage values.
The configuation shows you where the data was extracted from.
Table data – by URL
In the „By URL“ view, you see the individual performance of a URL in the two compared periods. The individual stats either send you back to GSC pre-filtered for a period, or to the compare view. With the compare links, you can deep dive into the performance of a page and check the individual keyword performance over time.
Table data – by Folder
When you switch to the „By Folder“ view, the data of all up to 1,000 sample URLs are aggregated. In this view, you can easily spot trends of clicks / impressions performance. By clicking on the individual period stats (like clicks, impressions), you will land in GSC pre-filtered for the period. A link on the compared data will show you the details in GSC.
Note: The CTR data is calculated by GSC Helper. We sum up clicks and impressions for each period separately, and calculate a „blended“ CTR by dividing total_clicks_period1 / total_impressions_period1 = ctr_period1.
Keep in mind that the folder data is limited to the 1,000 sample URLs. For larger websites, a click on the period or compare links will show you different stats, as GSC will show up to 1,000 sample URLs within this folder, while your prior configuration potentially included URLs within the max 1,000 rows of other folders as well.
For larger sites, I recommend filtering for a folder in GSC before generating the enhanced page stats.
Enhanced query performance
With version 1.6, the query performance („query insights“) functionality was added to GSC Helper. It provides more insights into your queries and your query coverage. Usually, Google only provides query data for ~ 30 to 40 % of all clicks. Check the „Query Clicks Coverage“ metrics for more details.
The enhanced table can be generated while being in the queries view by clicking the extension logo.
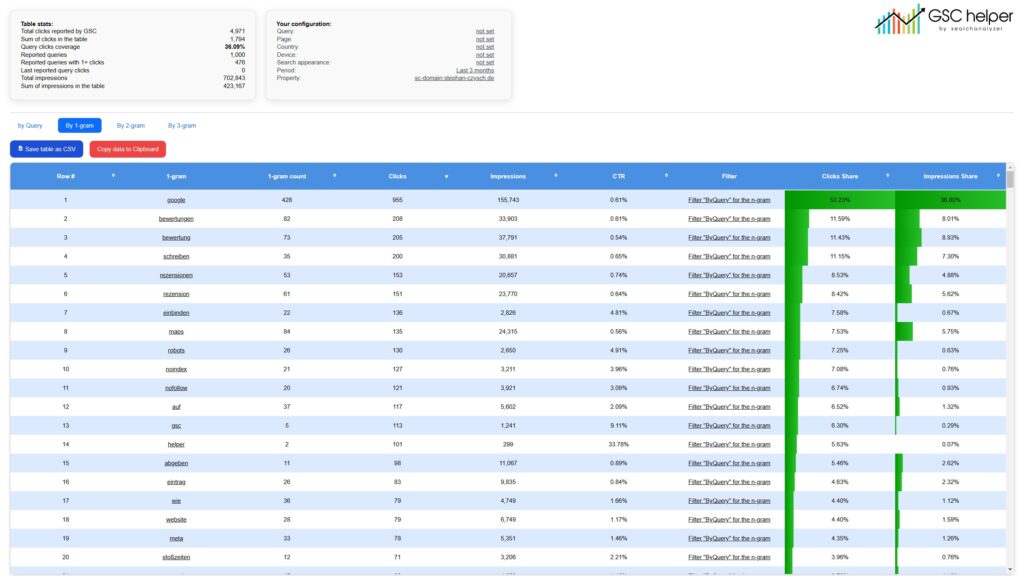
With version 1.9, the n-grams support was added. GSC Helper creates 1-gram, 2-gram and 3-gram and aggregates their stats. By clicking on the „Filter „By Queries for the n-gram“, you can filter the „By Queries“ view for search queries containing the n-gram.
The n-gram data is also included in the „By Query“ export, and each n-gram view can be downloaded as well.
Table stats
- Total clicks reported by GSC is extracted from the GSC Chart. This is total amount of clicks according to GSC
- Sum of clicks in the table sums up the individual clicks of each reported query (with the sample of up to 1,000 queries)
- Clicks coverage is a calculated value and tells you how many of the total clicks can be attributed to queries. Usually, Google provides 30 to 40 % of the queries leading to clicks, but there is a huge variety from e.g. page to page.
- Reported queries counts the amount of queries provided. Due to Googles 1,000 row limit, this number won’t exceed 1,000
- Reported queries with 1+ clicks tells you how many queries generated at least one click
- Last reported query clicks gives you the click stats of the last reported query in the table. When the last query has more than 1 click, you know that some keywords with clicks are missing
- Total impressions is extracted from the GSC chart
Configuration
- To provide more context, the configuration you used to generate the query insights is shown.
Table data
- Row # is simply the row number (by clicks descending)
- Top Queries shows the individual query provided by Google
- Clicks, Impressions, CTR, Position are the stats of the query
- Word count tells you the query word length
- Rounded position provides the rounded position of the query
- SERP page takes a „10 results per page“ logic and provides a rough estimate of the SERP page
- Rounded impressions rounds the impressions to -1
- Traffic share is a calculated metrics. It shows you the percentage of clicks of the sample query. It’s calculated by {clicks of the keyword} / {total clicks}
Enhanced query performance over time
When you are comparing two periods (e.g. by setting them via the preset compare dates from the context menu) and you look at your query data, a click on the extension logo will give you an enhanced view of your query performance over time. This was the big new feature of version 1.7.
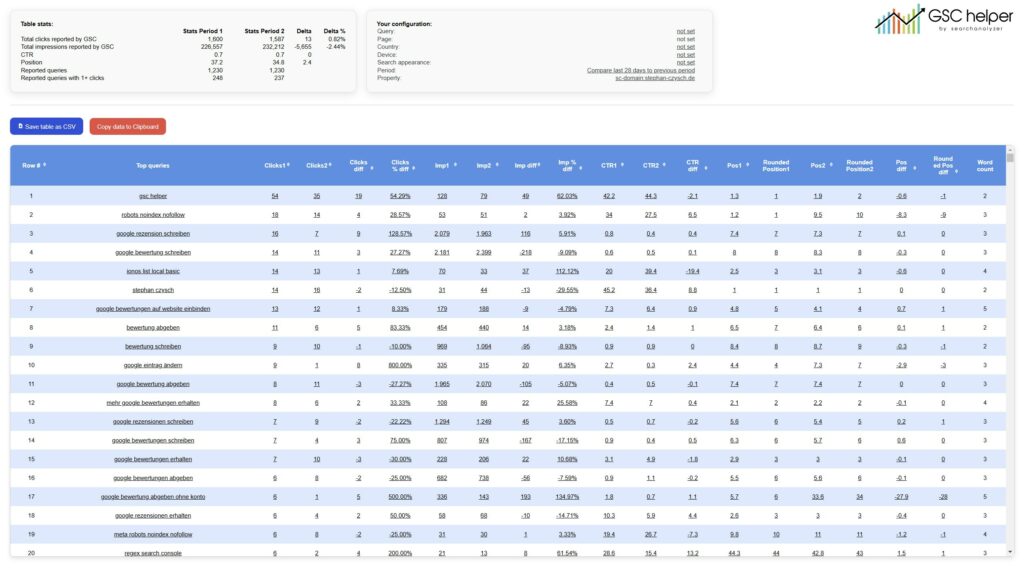
Depending on where you click, you either see the stats of the query in the respective period, or you can access the query comparision for the two periods.
Stats section
Since we have two periods to display, the stats section is different to other reports
- Total clicks reported by GSC is extracted from the GSC table.
- Total impressions reported by GSC is also extracted from the GSC chart.
- CTR is extracted from the GSC chart.
- Position is extracted from the GSC chart.
- Reported Queries is identical for both periods. Since Google combines the data of the two destinct periods, more than 1,000 queries are reported
- Reported Queries with 1+ clicks counts how many queries within the table have at least one click
The delta columns give you the absolut and relative differences between the two periods. The period stats are identified by e.g. „Clicks1“ and „Clicks2“ – the number indicates the period.
Table data
- Row number is simply the row number 🙂
- Top Queries shows the query
- Clicks1 is the amount of clicks in period1
- Clicks2 is the amount of clicks in period2
- Clicks diff is the absolut difference between the clicks
- Clicks % diff shows you the difference in percent
- IMP1 is the amount of impressions in period1
- IMP2 is the amount of impressions in period2
- IMP diff is the absolute difference in impressions
- IMP % diff shows you the difference in percent
- CTR1 is the CTR in period1
- CTR2 is the CTR in period2
- CTR diff is the absolut difference
- POS1 is the position in period1
- ROUNDED POS1 is the rounded position for period1
- POS2 is the position in period2
- ROUNDED POS2 is the rounded position for period2
- POS diff is the absolute difference
- ROUNDED POS diff is the difference of the rounded positions
- WORD COUNT is the word count of the query
Index coverage report actions
In the index coverage report, you can extract all up to 1,000 sample URLs with just one click. The sample URLs are stored in your clipboard.
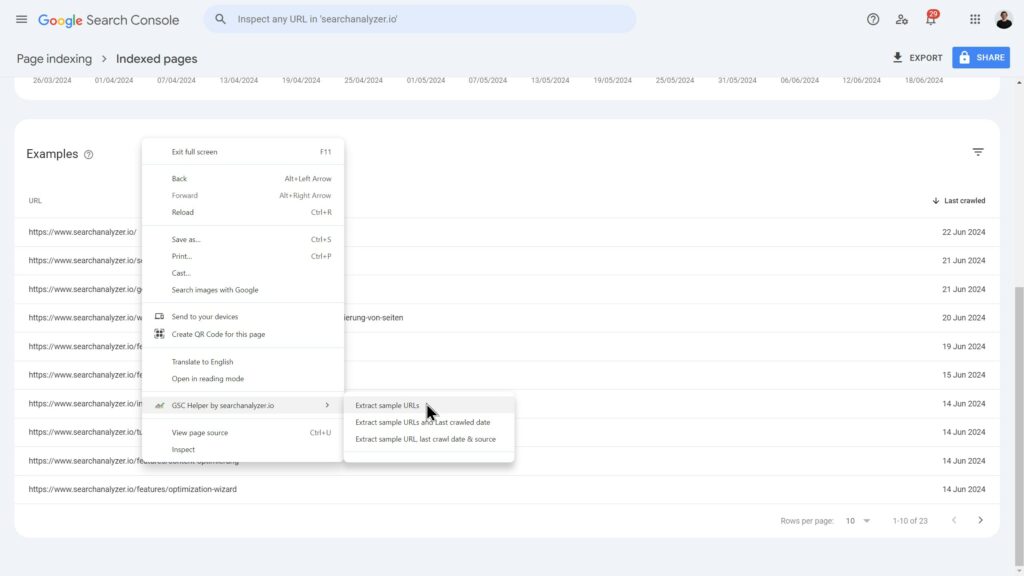
You have the following options:
- Extract sample URLs: Gives you only the URLs
- Extract sample URLs and Last crawled date: Additionally extracts the last crawled date
- Extract sample URLs, Last crawled date & source: Additionally extracts the report name, so you know where the URL was coming from
Account chooser on „not verified page“
Whenever you try to open a property you don’t have access to, GSC Helper offers an account chooser. The account chooser takes the URL you tried to open, and generates a direct link to the same configuration in another Google profile, or switches URL property to domain property (or vice versa).
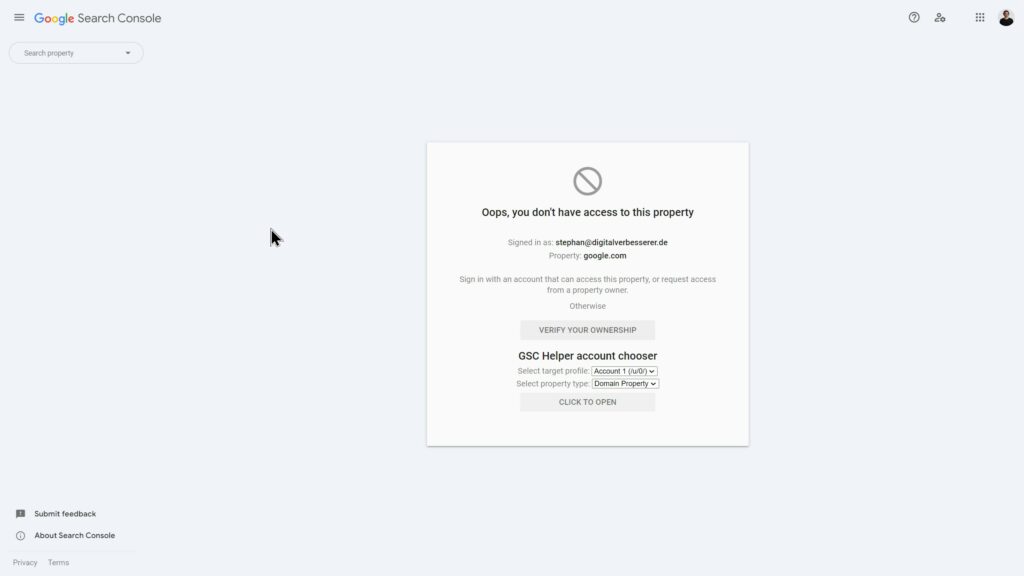
Given you are logged in into your private work account (which Google represents as /u/0/), and a company account (/u/1/) where all GSC properties are available, you choose „Account 2“ and, if needed, update the property type before clicking on the „Click to open“ button.
Within the options, you can configure the so-called „GSC Deep Link“ (the default action while you are outside of Google Search Console), define and modify your Custom RegEx and make other choices. On top of that, you will find a feature list and an overview on all logo actions.
Where do I find the options?
Perform a right mouse button click on the extension logo and choose „options“. Alternatively, you can access the options via the context menu while being within Google Search Console.
What can I do within „Configure GSC deep link“?
The GSC deep link is the default action of the extension while you are outside the GSC. A click will open the currently visited page in GSC performance report according to your preference you defined below.
These are the options:
- Default country: Choose if you want to see „global“ or only the data for a specific country. Keep in mind, that filtering for a country will give you preciser rankings, but anonymized clicks are completely filtered out.
- Time frame: Define the default time frame to see in GSC.
- Open website as …: Choose if a website should be opened within a „URL Property“ (starting with http..), or a „Domain Property“ (starting with sc-domain: in GSC). This refers to the URL structure you verified in GSC.
- Select your metrics: Google Search Console offers four metrics (Clicks, Impressions, CTR, Position). Based on your selection, all or only some of those metrics will be active in GSC by default (when you click the GSC deep link).
- Choose Google account: This option is relevant for people using multiple Google (not Chrome!) accounts at the same time. When you, e.g., have your personal account as your primary account, and all GSC profiles are in your secondary account, pick „Second account“ in the drop-down. All GSC deep links will then include a /u/1/ in the URL. This flag opens the site in your secondary Google account (/u/0/ is your primary account).
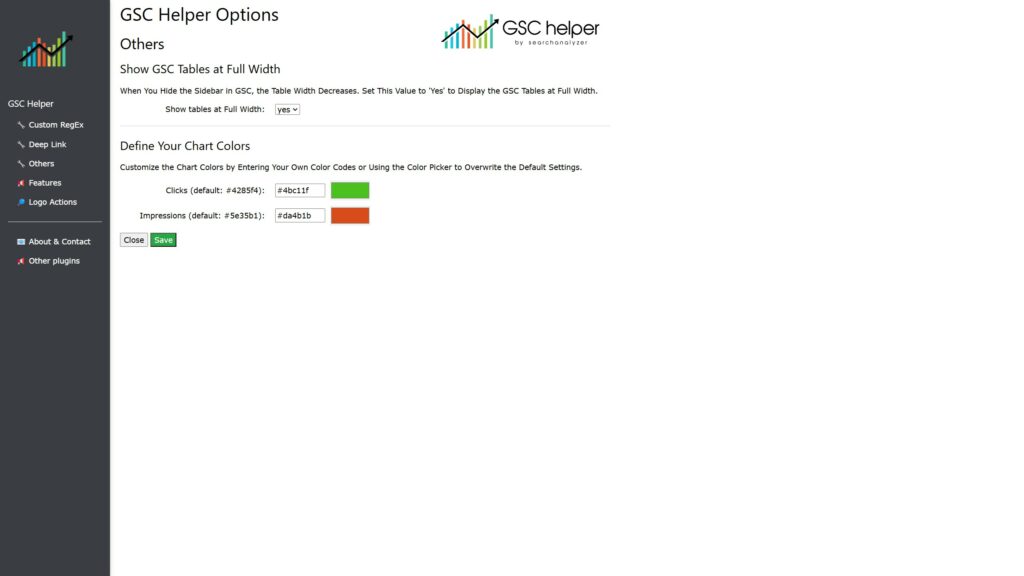
What is „Show GSC tables at full-width“?
When you hide the sidebar in GSC, the table width is decreased (instead of using the space). When you set the value to „yes“, GSC Helper overwrites the respective .CSS entry and the tables are always using the full available width.
What is „Add a Open URL Link in Front of URLs“?
To simplify opening a (sample) URL in your browser, GSC Helper can inject an „Open URL“ link in (most parts) of the interface, e.g. in the search performance or index coverage reports.
What is „Add Search Link For Queries“?
Do you want to see how the search results look like? Then this option is for you. It will add a Google Search-Link in front of search queries in the search performance report, allowing you to search for the query with one click.
What is „Define your chart colors“?
By default, GSC Helper visualisez clicks and impressions in the same color as Google Search Console does. If you want, you can use the color picker to choose your own styles. Alternatively, you can add your own hex color code directly.
GSC Helper calculates traffic shares for pages and queries and either displays them purely as numbers, or with an highlighted (gradient) background. By highlighting the data, you can easily see how quickly the traffic share grows, since only some pages or keywords generate a high share of clicks (and impressions).
Extension logo actions
Depending on if you are inside or outside Google Search Console, the extension logo has different functionality.
While you are inside of GSC
When you are inside Google Search Console, a click on the extension will generate vairous enriched reports, depending on the data you currently view in GSC.
GSC Helper currently provides enhanced views in these breakdowns of your GSC data:
- Date
- Page
- Page while you compare two periods
- Query
- Query while you compare two periods
Keep in mind that you need to be in the respective tab to generate the enhanced view. When no action is available for a view yet, you will see a basic alert.
While you are outside of GSC
When you browse the web, a click on the extension logo will open the currently visited (canonical) URL in Google Search Console, based on your configuration for „GSC Deep Link“ in the options.
While browsing the web, the context menu offers you various quick links to either open the current page or domain in Google Search Console reports.
Within Google Search Console, opening GSC within GSC wouldn’t make sense, so that’s why a different context menu is available to you while you are browsing within GSC. The „GSC context menu“ allows to apply filters or grab data.
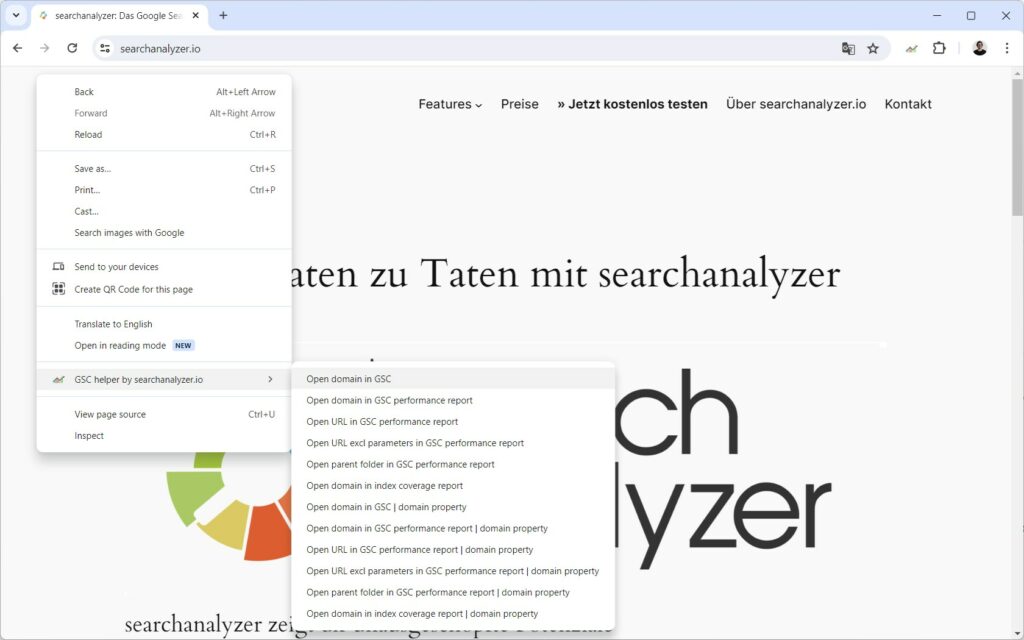
- Open domain in GSC ( | domain property): The currently visited domain will be opened in GSC, either as URL property, or domain property
- Open domain in GSC performance report ( | domain property): Opens the performance report for the current domain.
- Open URL in GSC performance report ( | domain property): The currently visited URL is set as „URL is“ filter in the GSC performance report, to analyze the performance of the page. Note: Your time frame preferences according to the options are taken into account here.
- Open URL excl. parameters in GSC performance report ( | domain property): In case the currently visited URL uses parameters, the parameters are removed within the „page is“ filter in GSC. Note: Your time frame preferences according to the options are taken into account here.
- Open parent folder in GSC performance report ( | domain property): When you are using a folder structure, this deep link will open the parent folder and set „URL contains“ as a filter. So you can see all ranking data for URLs sharing the same parent folder. Note: Your time frame preferences according to the options are taken into account here.
- Open domain in index coverage report ( | domain property): Opens the index coverage report for the domain, either as URL or domain property.
General FAQ
Is my data safe?
Your data is yours! Everything is processed locally in your browser and stays there!
Help, the „by month“ visualization isn’t working
To generate the ‚by month‘ visualization, click the extension logo while on the „dates“ tab of GSC. Make sure the URL includes the „&breakdown=date“ parameter, as this is the only location where the extension can access daily data.
If you still don’t see any data, verify that you’ve selected an appropriate time frame in GSC before clicking the extension logo. If the selected time frame is less than 7 days, visualizing data by week will not work 😉